We explain how to calculate percentage change in Power BI using DAX Formulas and the Quick Measure Builder for those who prefer to avoid writing formulas altogether. Percentage Change is a invaluable calculation to use in analysis of all kinds. It will help you normalize numbers and get a feel for the scale of change.
Table of Contents
Let’s jump in and take a look at the different ways to calculate percentage change in Power BI!
Why Calculating Percentage Change Is Important
Calculating percentage change is a fundamental aspect of analyzing business operations. It provides a relative measure of change over time. By expressing the difference between two values as a percentage it standardizes comparisons. This makes it easier to understand and communicate the magnitude of change.
Percentage changes are calculated in a wide range of scenarios. Some examples are:
- Investment Analysis: Investors often analyze the percentage change in stock prices, dividends, or market indices to gauge the performance of investments over time.
- Business Growth Metrics: Companies track the percentage change in sales, revenue, or profits to understand growth trends and make informed strategic decisions.
- Economic Indicators: Economists utilize percentage change to assess inflation rates, GDP growth, or unemployment rates, providing insights into the overall health of an economy.
- Personal Finance Management: Individuals may calculate the percentage change in their monthly expenses, savings, or income to create budgets and manage finances effectively.
- Marketing Campaign Evaluation: Marketing professionals use percentage change to compare the effectiveness of different advertising campaigns, helping to allocate resources more efficiently.
Regardless of the specific use case for your Power BI dashboard, it’s an invaluable tool to have in your reporting and analysis toolset.
Investopedia has a great write up on the math behind percentage change and some more business use cases for the formula.
The Basic Formula for Calculating Percentage Change
Whether you are creating a calculation in Power BI or Microsoft Excel, it’s important to understand the underlying mathematic formula for calculating percentage change.
The formula for calculating a percentage change, is as follows:
Percentage Change = ([New Number] - [Starting Number]) / [Starting Number]Subtract the New Number from the Starting Number. Then divide it by the starting number. The resulting amount will be the percentage change.
In most cases, the resulting calculation will be a decimal. Multiply the decimal by 100 to turn it into a number. In Power BI we can adjust the formatting to present the calculation as a percentage, which we will look at further.
Creating Calculations in Power BI with DAX
Before creating the formula for percentage change in Power BI, it’s important to understand Power BI formulas. Power BI uses a formula language called DAX. Calculations are referred to as Measures, and the syntax is quite a bit different than writing an Excel formula.
What are DAX Measures?
DAX (Data Analysis Expressions) measures are integral components in Power BI, and other Microsoft data modeling and analysis tools. Measures are custom calculations created using the DAX formula language that allow for advanced data manipulation and aggregation.
Here’s a brief explanation of what DAX measures are and why they are important:
- Custom Calculations: DAX measures are dynamically calculated across data in a data model. They can cover anything from simple math to complex statistical functions.
- Aggregation: Measures are often used to perform aggregations such as Sum, Average, Count, Minimum, and Maximum on numerical data.
- Dynamic Analysis: They automatically adapt to the filters in which they are viewed. Unlike regular calculations that only compute once, DAX measures recalculate to reflect changes in filters or slicers,
Note: Aggregations are incredibly important in Power BI. Because Power BI is designed to allow users to drill down into data, calculations have to occur at different levels of reporting. For example, a Sum formula will allow you to view total sales at the state, county, city, or individual store level.
How to Create DAX Measures
Creating a new measure in Power BI is as simple as clicking the New Measure button on the Home tab of the Power BI Ribbon.
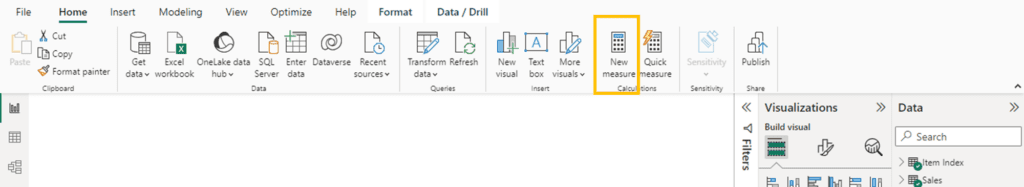
After clicking on New Measure, a formula bar will appear. The default text is: Measure =
Measure is the default name of the new calculation that we will be setting up. The right side of the = sign will be the formula used for the percentage change calculation.

Now that we know the formula for percentage change along with the basics of Power BI DAX formulas, let’s look at some different formulas to calculate percentage change in Power BI.
How to Calculate Percentage Change in Power BI
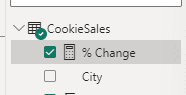
To calculate the percentage change variance, we are going to use a dataset with two columns. One called CurrentYear and the other called PriorYear. Both columns are on a table called “CookieSales.”
The New Measure is called % Change.
The formula looks as follows:
% Change = (SUM(CookieSales[CurrentYear]) - SUM(CookieSales[PriorYear]))/SUM(CookieSales[PriorYear])There are a number of important items to keep note of.
- Each Column Name is surrounded by [ ] square brackets
- The Table Name comes before the Column Name
- There is a SUM formula before each Table Name and Column Name
- Parenthesis surround the difference calculation, and are also used in the SUM formula.
Note: Power BI will auto-complete the table name and the column name as you begin to type. Start your formula with parenthesis and SUM. Then use the Tab key to auto-complete suggested column and table names.
Alternative Way to Calculate % Change in Power BI
Another way that you can calculate a percentage change is by dividing the sum of the New Number by the Sum of the Old Number and subtracting 1 from the final result.
In our example from above, it will look like this:
% Change = SUM(CookieSales[CurrentYear]) / SUM(CookieSales[PriorYear]) - 1In most cases this will be a simpler way to calculate the percentage change. It’s much easier to read. Remember that after you begin to type SUM( you can let Power BI auto-complete the Table Name and the Column Names.
Don’t forget to close the parentheses around each one!
Calculating Percentage Change with Power BI Quick Measures
Power BI Quick Measures are our preferred way to create many calculations. Quick measures are a way to drag and drop columns into a template and Power BI will automatically generate the entire formula for you.
To create a Quick Measure, from the Power BI Ribbon, Click on Home > Quick Measure and select Percentage difference from the Calculations tab.

You will then be prompted on the Calculations screen to drag and drop the old value, or base value and the Value to Compare or New Value.
The formula will automatically be generated in the formula bar and a default name will be assigned to the left of the = sign.

An added benefit of using Quick Measures for percentage difference calculations is the automatic generation of error handling for times when the denominator is zero.
After the formula is generated click into the formula box and press enter.
You can re-name the new DAX formula before it is saved in the formula bar, or you can double click on the measure name in the data panel to update it after it’s been saved.
Calculating Percentage Change in Power BI Using the Divide DAX Formula
Another option for calculating the percentage change in Power BI is to use the DAX formula for DIVIDE.
The formula is as follows:
% Change = DIVIDE(SUM(CookieSales[Current Year]), SUM(CookieSales[Prior Year])) - 1
When using the DIVIDE function in Power BI DAX there are a couple things to keep in mind.
- Many DAX formulas separate values and parts of formulas with a comma ,
- You will need to place parenthesis around both values in the divide formula and the SUM formulas.
Tips and Tricks for Calculating Percentage Changes in Power BI
Now that we have covered a few different ways of creating a percentage change formula in Power BI to identify percentage variances and differences, let’s look at some tips and tricks to get more out of the calculations.
Convert a Decimal to a Percentage in Power BI
After creating a formula in Power BI, you can click on the name of the measure in the data panel. Then update it to a percentage format using the formatting options in the Measure Tools section of the Power BI ribbon.
After selecting a measure, the following formatting options will appear.

Click on the percentage % button to convert from a decimal to a percentage format. You can adjust the number of decimal places shown by pressing the up and down arrows to the right of it.

The resulting formatting of the options above will look like the following screenshot when added to a Matrix Visual.

By using the formatting options to convert a decimal into a percentage, it avoids the need to multiply the decimal by 100. The formatting is automatically applied to the measure.
Avoiding Errors in Power BI When the Denominator is Zero
Power BI and most computer systems will have problems dividing by zero. In Power BI, you can avoid a divide by zero error by wrapping a percentage change calculation in an IF statement.
The IF statement tests if the denominator is Zero, and if it is then we can tell it to return a blank.
% Change =
IF(
    SUM(CookieSales[Prior Year]) <> 0,
    SUM(CookieSales[Current Year]) / SUM(CookieSales[Prior Year]) - 1,
    BLANK()
)
The IF statement is checking that Prior Year amount does not equal zero. If it does equal zero, then it returns a Blank. This is one of the reasons that we enjoy using Quick Measures. It eliminates the need to write additional formulas.
Conclusion
Calculating the percentage of change in Power BI can be done using multiple different DAX Formulas, or a Quick Measure. Our first preference is a Quick Measure because of the ease of use and automatic error handling for times when datasets contain zeros and would normally confuse Power BI and generate an error.
Even though Quick Measures can be used, it’s best practice to understand the different DAX formulas that are available to you. Understanding the basic syntax of DAX will only help you in the future to either troubleshoot errors, avoid them, or creating more advanced custom calculations.