Learn how to calculate a Percentage of Total in Power BI. We show you the calculation with DAX formulas and how to calculate using no formulas similar to an Excel Pivot Table.
Before going to in-depth, we want to note a few key points when calculating percentage of totals using Microsoft Power BI that will help inform your approach.
- Power BI typically has multiple ways to achieve the same task.
- The exact method may differ slightly based on the visualization you are using in Power BI
- ChatGPT-4 is an excellent resource for Power BI DAX formulas
Calculating % of Total in a Power BI Matrix Visual
The Matrix visual is without a doubt our most used visualization in Power BI. We build a lot of accounting and financial statement dashboards, and the matrix visual is the closest thing you can get to re-creating an Excel Pivot Table in Power BI.
Luckly, you can calculate a totals a percentage of a column or as a percentage of a row in a similar way.
In our screenshot below we, selected the Matrix Visual from the Visualization panels, with rows for Product Category and Columns for Sales Amount.
Place the amount that you want to calculate as a percentage of total into the values column. By default, Power BI will set the aggregation method to Sum, similar to a pivot table.
You can drag and drop fields or columns from the right into rows, columns or values. Power BI will automatically aggregate them for you. Aggregation is a key part of Power BI. It’s the secret sauce that allows you to have beautiful interactive visuals that report viewers can drill into to find more detail.

If you click on the small down arrow with one of the values fields that you just added, Power BI will show you a list of aggregation methods.
Click the Down Arrow > Show Values as > Percentage of Column Total
You could also show as percentage of row, or grand total. These options are available on most of the visuals in Power BI and are by far the easiest way to calculate a percentage of total. We recommend this approach over more complicated DAX formulas whenever possible. It’s the easiest way for other users to identify a calculation.
Note: If you double click into the Values name, you can re-name fields. The new names will show up on the visual, but it will not change the column name elsewhere in your data.

Best Books to Learn Power BI


From Beginner to Advanced, Power BI books are great ways to learn new techniques and are great reference guides for mastering DAX.
Pop! Automation may receive affiliate commissions for purchases through these links at no additional cost to you.
Using Power BI DAX Formulas to Calculate a % of Total
Because not all visuals allow you to calculate a % of total, we will cover how to do this calculation using DAX formulas. If you are unfamiliar with DAX it stands for Data Analysis Expression. It’s basically the formula language that Power BI requires when typing in Formulas.
It differs from Excel formulas in that it requires you to aggregate data. Power BI requires you to do this to create measures. Measures are more 3 dimensional than regular Excel formulas and they allow users to drill down into data giving them the ability to have an interactive dashboard.
Calculate a % of Total with a Calculate and Filter Formula
Our first approach is to use a Calculate and Filter function. This is our go to method because you can use the same set of formulas for many different uses in PowerBI. It’s highly versatile and simple to remember once you’ve used it a few times.
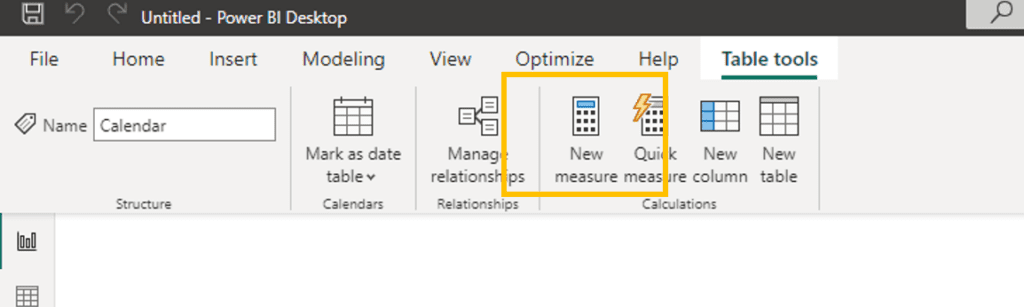
Step 1.) Create a New Measure
When you create a measure, you can think of it like a formula that is assigned a name that you can re-use in the future. You can either click New Measure under Table Tools from the top tool bar or right click the list of Fields in the Data Column and Choose New Measure.
Step 2.) Sum Sales Amount
In the formula bar that comes up, Calculate the percentage of total in two steps. First add all of the data that you are splitting out into each row or column. Power BI will automatically filter and split this data into the sections that you need
Name of New Measure = sum([ColumnName])
Step 3.) Divided the Sum by All Values
After the initial sum, we have to calculate a total. The syntax for the formula is very similar to the first part but we need to add two additional pieces of formula.
- CALCULATE – this section of formula tells PowerBI to ignore the other filters on the page since it will automatically filter based on the page, or visual and group it into categories for you. We need to ignore this because want it to sum every number that’s on the visual.
- FILTER on All – There are many different ways to filter data in Power BI, but this example we want it to Ignore All Filters. You have options to filter on all except, ignore specific filters etc.
The combined Formula will look like the following:
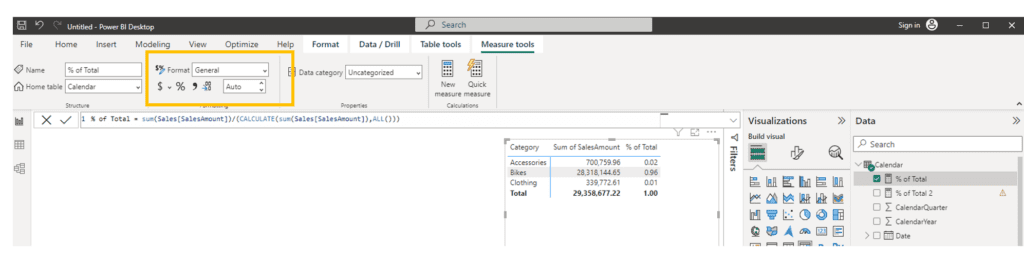
% of Total = sum(Sales[SalesAmount])/(CALCULATE(sum(Sales[SalesAmount]),ALL()))
The section before the = sign is the name of the Measure.
The second section before the / is a calculate for the Sum of SalesAmount column.
The third section says to CALCULATE the Sum of Sales Amount, Ignore all Filters.
Note: Be careful to make sure that you have all of the parenthesis in the right place. PowerBI is less forgiving than Excel, and you need to ensure that for every open parenthesis you have a closed parenthesis. You also have to define them because it follows the regular order of operations.
Note: Many times we will split measures into multiple parts. It makes formulas easier to read and also makes them modular. Meaning that you can then re-use parts of formulas at different times within your dashboard which speeds up development.
Calculate a % of Total with a Divide by Formula
An alternative way to build your Power BI DAX formula is to set it up with a Divide formula. In general, we tend to avoid these because it’s a less versatile method than the one mentioned above but it’s worth being aware of.
Microsoft added many DAX shortcut formulas to PowerBI in an effort to make things simpler. While these give you a specific Divide Formula to use it’s a very specific method and we don’t see how it’s any easier than dividing two numbers by each other like you would in regular math.
The Syntax for Divde is:
% of Total = DIVIDE(SUM(Sales[SalesAmount]),CALCULATE(SUM(Sales[SalesAmount]),ALL()))
Where this differ from above is that instead of Summing the SalesAmount column and dividing it, we define the DIVIDE DAX formula and then use commas to separate the Numerator and Denominator.
Note: Many formulas in Power BI Dax are based on the concept of separating formula sections with commas. For Example, DIVIDE([Numerator],[Denominator])
Format a Percent of Total as a Percentage
The final step after creating a total percentage measure is that you can format it using the Format Options under the Measures Tools section of the toolbar. Select the new Measure from the right most column and you can click on the % symbol.
You may also need to adjust the decimals that your percentage is showing. This is done with the ” Auto ” field under formatting options. You can either type the number of decimal places you want or click the up and down arrows.
Calculating Percentage of Total for Categories Only
One more situation that occurs often in Power BI is needing to calculate a percentage of total for categories. In the example below we have an Income Statement that has a normal % of Total calculation. It will show the percent total for each group subtotal along with the line item detail that makes up the category subtotal.
Power BI dynamically calculates category and sub-level detail for you.
However, if you want to modify your formula to only show a % of total for category subtotals, you will need to use the IF and INSCOPE modifiers.
Essentially you setup a statement to check IF a row is INSCOPE on the visual which is a test for whether or not it’s currently being filtered.

As you can see the two DAX calculations contain the same core DIVIDE calculation, but the second one is modified to only show specific rows that correspond to categories.
Conclusion
Percentage of total calculations in Power BI are incredibly useful. You can quickly create DAX formulas to divide the numerator by the denominator and it will result in a decimal. After the calculation is complete, modify the formatting options for the new measure to change it to a percentage
When setting up a percentage of total calculation for a category subtotal, you can modify the standard percentage of total formula to check if a row is in scope. This will leave the rest of the rows empty and only show totals at the category subtotal level.