You can export data from Power to Excel by clicking the three dots that appear when you hover over a visual Exported data is unformatted and limited to the data required to present that visual or by Row Level Security. Full datasets can be exported from Matrix or Table Visual. Users can also use the Analyze in Excel feature to connect directly from Excel to a Power Bi Semantic Model.
Table of Contents
Export from a Power BI Visual to Excel
To Export data to Excel using Power BI you can open a report in Power BI Desktop or the Power BI Service at PowerBI.com Then hover over a visual and click the three-dot ellipsis button in the top right corner of the visual. An export options dialog box will appear allowing you to select which level of detail you wish to export.

The data export dialog box gives users the option to export data in the current layout, which is mostly relevant when exporting from a table or matrix visual, summarized data, or you can establish a direct connection between Excel and the underlying Power BI Semantic Model.

When exporting data from Power BI, users can choose between the Excel .xlsx file type or the more generic .csv file type. Each of these options are subject to maximum row limitations.
- CSV – 30,000 row maximum
- XLSX – 150,000 row maximum
- XLSX with Live Connection – 500,000 maximum
Because of the row limits, you may have to filter your Power BI and export multiple files to consolidate again once imported into Excel.
Using Power BI Analyze in Excel
An alternative to exporting data from Power BI to Excel is to connect Excel directly to a Power BI semantic model. This method creates a new Excel file with a pre-setup pivot table that allows you to drag and drop any column of data from the underlying data model into the pivot table. This method can be extremely useful when data updates regularly to avoid having to manually export to Excel each time.
To start, open a published report from PowerBI.com and click on Export > Analyze in Excel

The export process takes around 30 seconds to a minute to setup the new file. The newly generated Excel file will open in Excel Online.

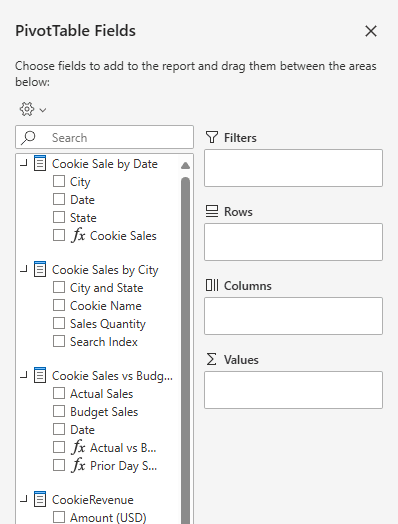
Once Power BI finishes setting up the Excel file, you will have a blank pivot table on the left side of the screen and a Pivot Table Field panel on the right side of the screen. This is where you can drag and drop columns from the underlying data to populate the pivot table.
This option is not always available as many companies will disable it. While the feature respects Row Level Security (RLS) it gives people access to the full dataset when RLS is not in effect even if specific columns of the underlying data are not used in a visual visible in the report published to PowerBI.com