Power BI developers have two options to add new columns. They can either create a New Column from the Report View or they can add a Custom Column from Power Query. We’ll explain how to add columns using both methods, and how to choose the appropriate one for your reports.
Let’s dive in!
Table of Contents
Adding New Columns from the Report View with DAX
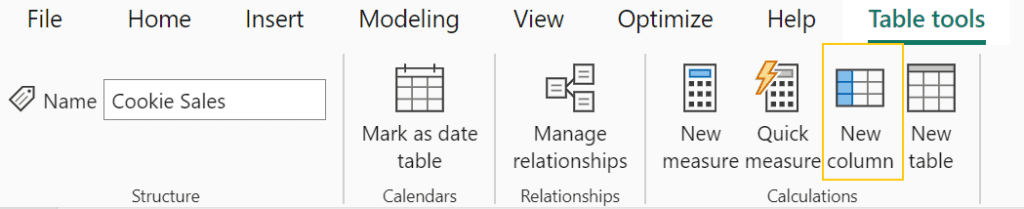
To add a new column in Power BI from the Report View, navigate to the Modeling Tab of the Power BI Ribbon, and select “New Column”. A formula bar will appear where you can type in a formula. The syntax is ColumnName = “Text” or ColumnName = 123 if creating a column with a fixed number value.
Text values need to be surrounded by quotes. Numbers do not require quotes around them.
The New Column button is available under Table Tools after selecting a table from the data panel list on the right side of Power BI.
The formula bar below, shows New Column = “Text” with the measure added to a visual.
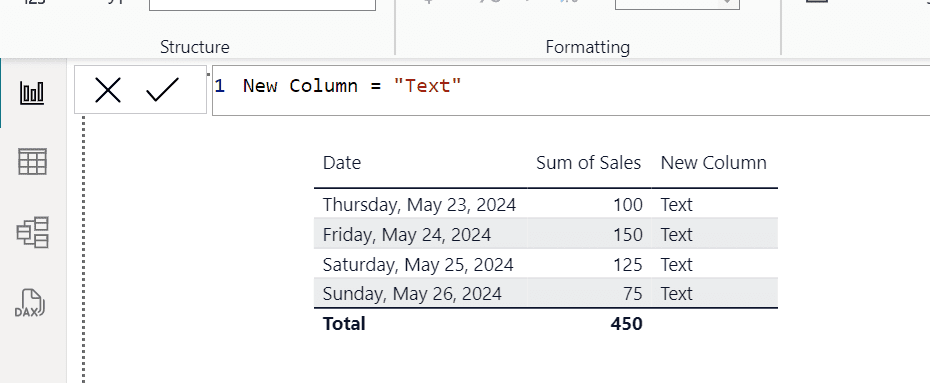
The value “Text” is generated for every row in your dataset. You can also create columns with fixed numbers along with fixed text values using this same method.
Adding New Columns using Power Query
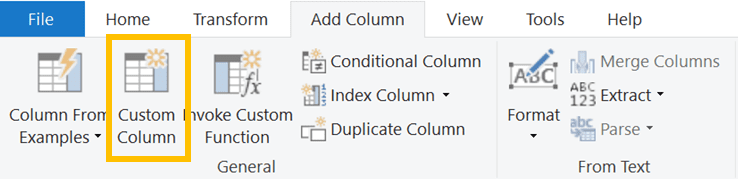
To add a New Column in Power Query, navigate to the Add Column section of the Power Query Ribbon, and press the Custom Column button. A dialog box will appear where you can enter Power Query M formulas to fill in your new column. Use the formula = “Text” to add fixed text or formula = 123 to insert a number.
The simple formulas for adding fixed values to a column are very similar between DAX and Power Query, but be aware that more complicated formulas will differ greatly. These two sides of Power BI use different formula languages.

When you press OK, a new column will be generated with the text or number values that you’ve entered.
Updating Power BI Column Data Types
After creating a new Custom Column in Power Query, you will need to assign the column with a data type to avoid errors. Each column has a type, numeric, text, date etc. and it tells Power Query how to interpret the values. For example, numeric columns can be added together while text columns can be concatenated. If you try to mix and match the two in the same formula it will result in an error..
Data Types can be updated by right clicking the column header, and go to Change Type in the contextual menu, then select the type of data that the column represents.

Choosing Between DAX and Power Query to Add Columns
In Power BI there are two different methods to add columns with values. You can use DAX from the report builder screen, or Power Query M formulas within the Power Query Editor. Both methods result in a new column but can have a significant impact on report performance due to execution timing.
DAX queries are executed when and end user interacts with a report, such as adjusting a filter or slicer on the page. Each change in view causes Power BI to re-calculate DAX queries which can take a significant amount of time, especially with large datasets.
Power Query is executed when a report is refreshed. This typically provides end users with a better experience and faster report because the calculations can be scheduled to refresh during off hours.
We generally prefer Power Query to add columns but if we are working with a small dataset, we sometimes use DAX for ease of use. There are also connection types that won’t allow you to switch to the Power Query editor, removing it as an option for some reports.