Power BI only supports active relationships between a single column from each table when creating relationships between tables. However, there are times when you need to build a relationship between two tables based on multiple columns. We’ll explain how to create a relationship in these cases and alternative options that are worth consideration.
Table of Contents
Understanding Power BI Relationships
Power BI relationships are connections established between different tables within a Power BI data model that link tables based on common fields. They help Power BI understand how data in one table relates to data in another. For instance, a sales table can be linked to a customer table via a common customer ID field.
By establishing a relationship, there is no need to join the underlying data and you can view the diagram of inter-connected tables in the Model view. Relationships can be one to one, many to one, or many to many based on the rows in each table and can also have defined filtering directions.
The Limitations of Power BI Relationships
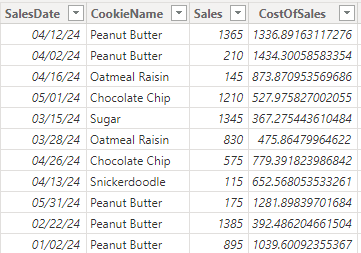
One of the biggest limitations of Power BI is that you can only build a relationship between two tables using a single column. This creates an issue when you want to compare data based on multiple fields. For example, we have a Sales Table and a Sales Quantity Table that reports data by name of the product and the Sales Date.
To build an accurate relationship between these two tables, we want to use both the Sales Date and the Product Name columns which is not an option.

If we were merging tables in Power Query you can select multiple columns to merge on, but relationships do not have this capability.
Creating Relationships with Multiple Columns
To create a relationship using multiple columns in Power BI, you have to create a new column that combines the values of other columns. This creates a primary key between tables which can then be used as the common column between tables when building a relationship.
Step 1.) Concatenate to Create a Key Column
To create a key column that combines the values of multiple columns to a single column you can use DAX or the Power Query Editor. In our example, we will use DAX for its ease of use and availability when you’re not in import mode.
Create a New Column in Power BI and combine two or more columns with an & symbol between the column names by clicking on New Column from the Home Tab of the Power BI Ribbon.

Then use DAX to combine columns with a formula using the following syntax:
Key = 'TableName'Column1 & 'TableName'Column2The & symbol between two columns will concatenate them into a single string. You can concatenate as many fields as needed.
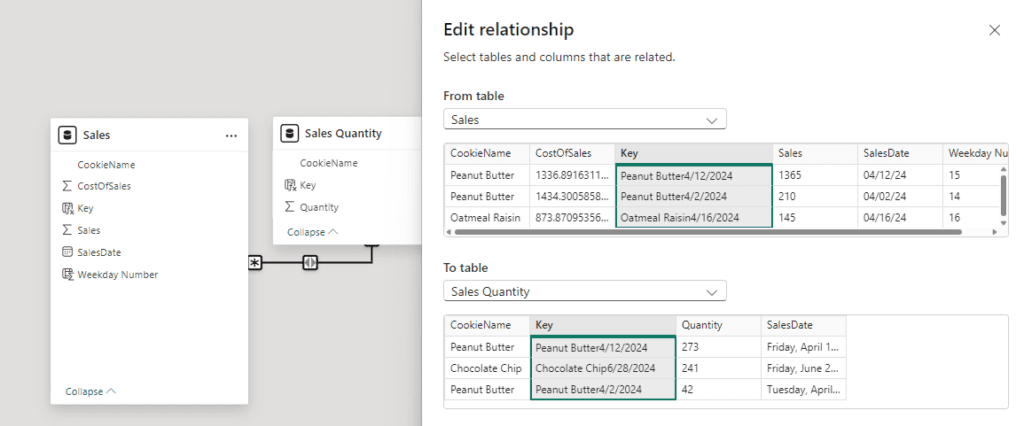
Our dataset looks like the following where we concatenate our Product Name and Sales Date.
The DAX formula when creating a New Column must point to specific columns that exist on the same table.

Step 2.) Repeat for Multiple Tables
Create a Key Column by creating a New Column on each table that will be related. The column names do not have to be the same between tables but the contents will need to match each other once combined.
Step 3.) Build a Relationship Between Tables
With a Key Column created, you can drag and drop on column name on top of the other in the Power BI Model View. Double check the From and to table along with the filtering direction. Once complete a relationship will be created that takes into account the combined values of multiple columns when assessing the relationship.
Alternative – Merge Tables in Power Query
As an alternative option to creating New Columns using DAX, you can also concatenate values in Power Query by creating New Custom Columns on each table and concatenating the contents of each column. Once you close and load Power Query the columns will be available in your data model where relationships can be built.
You can also use the Merge Queries function in Power Query to combine tables based on the values in multiple columns. This creates a single wide table made up of the contents of two tables that otherwise would have a relationship built between them.
This option is not always available and depends on your connection mode. There can also be performance implications of choosing Power Query vs DAX. Power Query executes during a data refresh while DAX executes when users interact with a report.